Graph 1 is the 3 month data on Clinton Trump in a "two-way" race.

Graph 2 is the 3 month graph of the "four-way" race.
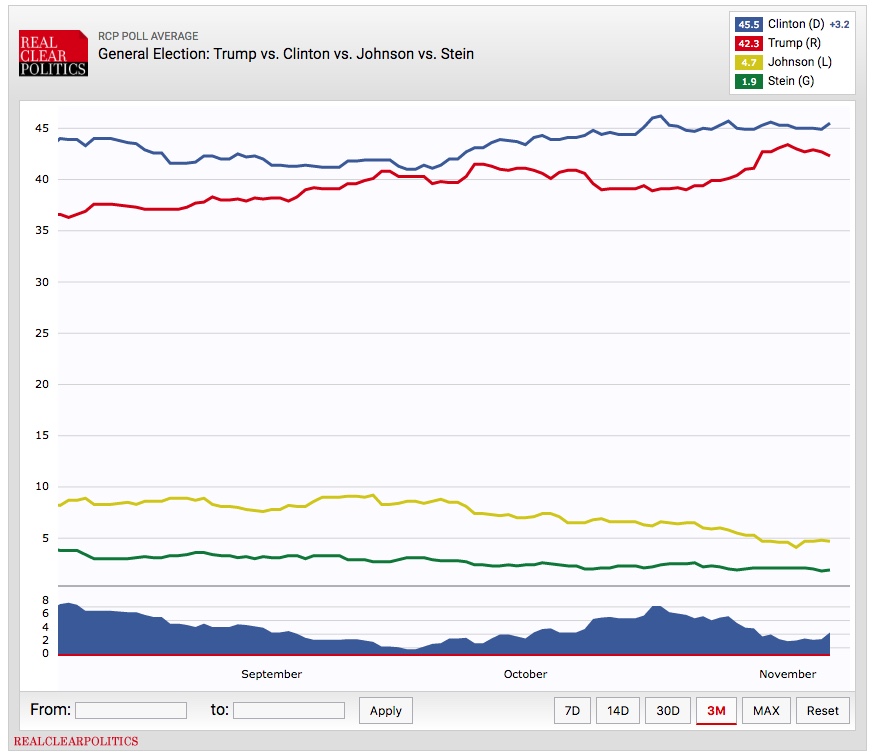
There are two striking features from graph 1.
1. Clinton's numbers bounce between 45% and 49%. {hitting the mark with 47.6%}
2. Trump's number bounce between 40% and 45%. {stunning at 47.4%}
This would suggest Clinton has the advantage as the high end of Trump's numbers are at the low end of Clinton's numbers - the two lines never crossed. This scenario could happen resulting in a very long night. UPDATE: Nate Silver of 538 explains the probabilities due to the uncertainties in polling and the action of undecided voters. But nonetheless, the most likely outcome is that Clinton will edge out Trump by 2 to 3%.
There are two striking features from graph 2 regarding the two minor party candidates.
1. Johnson's numbers maxed out around 9% and have declined to 4% as election day approaches.
2. Stein's numbers peaked near 4% but is now closer to 2% as election day approaches.
This suggests that when Clinton had the larger lead, more voters entertained the idea of a minor party candidate. But as the race has tightened, probably about half of those voters have moved back to one or the other main party candidates or will cast no vote on POTUS.
Thus, what happens on November 8?
Green party candidate Nader got almost 3% in 2000 in what was known to be a close race. This indicates that Green voters are fiercely loyal. Thus, I suspect, the Stein supporters will stick with her and be joined by Sander supporters who refuse to support Clinton. My prediction Stein gets 1.7% of the vote.
As for the Johnson/Weld ticket, I think they continue to lose support. Their repeated "foot in mouth" episodes have alarmed the loosely adherent supporters. How does 3.6% sound? Because there are some states that are very strongly Clinton or Trump, the Libertarians may get some protest voters. However, the dream of a historic non-major party performance is gone with the overall tighter race between Clinton and Trump. Of course, it will still be historic for the Libertarian party in specific.
Thus, final figures:
48.6% Clinton {currently 47.6% likely to increase some due to California}
45.9% Trump {currently 47.4%}
3.6% Johnson {3.2%}
1.7% Stein {1.0%}
0.2% Others {0.5%}
But of course, it is the electoral college that actually determines the presidency.
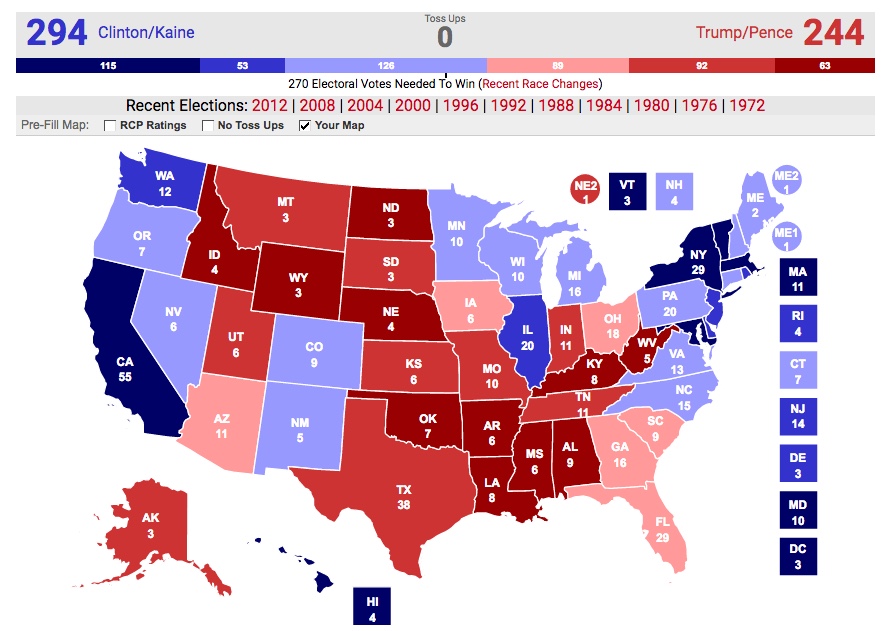
Map 1 is the Real Clear Politics map with the "toss-up" states in gray.

Map 2 is the my adjustments to the RCP map.

Some of the "toss-up" in map 1 are probably not that close. Colorado, Maine, New Mexico I think are in the Democratic column as is Pennsylvania, Virginia and Michigan. Philadelphia is so strongly Democrat that Republicans can't get enough supporters in the rest of the state to off-set that advantage {Clinton support was too little too late and called to Trump breaking the "blue wall"}. Same in Detroit thus keeping Michigan safe for Clinton {Trump up 10K votes but still counting as of Thursday}. And the suburbs of northern Virginia just outside of DC is probably too strongly for Clinton for Trump to compensate with showings in the rest of the state {Clinton support came in and edged Trump}. Though Georgia is probably trending away from the GOP, don't see Trump losing that state.
As you can see in map 2, Trump would have to win all the gray locations to get to 270.
Thus, the balance hangs with these 8 elections:
Poll closing time (EST)
7:30
North Carolina {this race was close but eventually called for Trump later in the evening}
Ohio {this race was not close and that was a sign there was something happening}
8:00
Florida {this race was close but eventually called for Trump later in the evening}
Maine CD2 {I don't know when it was called for Trump}
New Hampshire {ultimately on Wednesday or Thursday called for Clinton but it didn't matter}
9:00
Arizona {ultimately on Wednesday or Thursday called for Trump but he had exceed 270 already}
10:00
Iowa {this race was close initially but eventually called for Trump later in the evening}
Nevada {this race was close but eventually called for Clinton later in the evening}
Probably sometime around 11pm, North Carolina, New Hampshire or Nevada will be called for Clinton thus ending the night of drama. {The drama started with Minnesota and Wisconsin were too close to call a clear sign something was happening in the "blue wall." Eventually, Clinton edged Trump out in Minnesota but the shocker was Wisconsin going Trump}.
Final map:
Will Clinton have any "coat-tails" to bring the Senate into Democratic hands?

It is going to be close, RCP has 8 races as toss-ups. I think the Democrats take Nevada, Wisconsin, and Pennsylvania. While the GOP take Indiana, North Carolina and Florida. The cliff-hangers will be Missouri and New Hampshire. I am calling it 50-50 split with NH going GOP and Missouri Democrat. With the VP Kaine, the Senate will organize with the Democrats in control.
No comments:
Post a Comment