Every wonder how something works?
With all the talk of personal DNA sequences and other leading edge sequence based research methods, I wondered, how do you do high speed DNA sequencing? In Google searches, I found various text descriptions of how they work but couldn't get my head around what they were saying.
Finally, hit a link to a youtube video and voila, it makes sense to me now!
Its amazing!
How it works is a synthesis of multiple technologies:
Molecular biology methods to make the DNA samples and extending the strands
Nanotechnology manufacturing of flow cells with capture sites
Fluorescence chemistry
Digital image capture technology
Computing power to turn the captured images into sequence data
Politics: The Baby Boom Cohort
All the talk about what to do about the fiscal cliff is on the relatively short-term side of the story: tweaks of tax rates, elimination/capping of some deductions and relatively minor changes on spending.
The hard reality not being dealt with is the large size of the Baby Boom Cohort (1946-1964). The leading edge of that cohort started retiring in 2011. If life expectancy holds at 78 years, the trailing edge will pass away in 2042. Thus, there is a 31 year window when this group will be collecting Social Security and Medicare benefits.
Unfortunately, program benefits were promised to this cohort that are now financially unsustainable.
But is anyone really addressing this in DC?
I don't have access to CBO economists to project out how big the changes need to be to prevent the deficits and debts from getting worse than they are now. But I would think the most obvious thing to do on Social Security is to begin trimming back the benefit formula and for Medicare to begin asking participants to bear a greater cost of the program. Of course, politically, people will say, you want to throw grandma under the bus and push grandpa off the curb. But if nothing is done, the cost of these programs is going to crush the next generation in taxes and debts.
Science: The task of a scientific publication reviewer
One of the professional community service responsibilities of a scientist is to review articles submitted for publication. There aren't any formal classes on the process. Most of us learned to do it by seeing it done by more experienced reviewers.
A recent Google search turned up this article.
I thought it offered a good perspective on the process and summarized into 10 rules.
I suppose their Rule 4: As a Reviewer You Are Part of the Authoring Process has been my main guiding principle.
When someone in our research group writes a paper and circulates it for comments, our task is to look for gaps in the data, unclear explanations to be cleaned up and over-reach/flaws in the conclusions. The goal is improving the paper. And so, as a reviewer, I try to have that mindset.
I also found Rule 3: Write Reviews You Would Be Satisfied with as an Author to be crucial in finding the right tone of voice. Being at the receiving end of sarcastic reviews or reviews that make you wonder if they read the paper is very frustrating. Even though the vast majority of journals use blinded reviews, I think a good attitude to take is to write the review as if the authors of the submission would find out who you are.
Life: A Day of Loss at Sandy Hook Elementary School
Despair we fight to keep at bay
As we cry for those lost today
May arms enfold those who sorrow
And love be present when they awake tomorrow
To those near give strength for the sad to borrow
To have hope renewed in the days after tomorrow
As we cry for those lost today
May arms enfold those who sorrow
And love be present when they awake tomorrow
To those near give strength for the sad to borrow
To have hope renewed in the days after tomorrow
Politics: Balancing the federal budget 2% spending, 3% economic and 5% revenue growth scenario
Okay, let's be more optimistic and say that the economy will grow at 3% per year on average leveling out booms and busts. Using the similar concepts as described previously, we set spending growth to 2% and revenue growth to 5%, we get to balance at 2027 just like in the 1-2-4 scenario. The final balance point is around 21% GDP. See graphs below:


Suffice to say, I'd like to see the types of charts I'm generating here rather X number of dollar of tax increases and Y number of dollars in spending cuts reported in fiscal cliff negotiations. The cited numbers are always relative to some unstated "baseline." Instead, they ought to show absolute dollar charts like what I have here. Also, the fiscal cliff negotiators probably have unstated economic growth projections that are unrealistic. I just wish the politicians would just tell the truth about the numbers!
As an FYI, the starting point data I used was obtained from the White House budget history web page. Specifically, I looked at table 1.3 and used the data in "current dollars" and "as percentage of GDP." They offer budget projections to 2017. What is quite striking is that their rate of revenue increase and spending are considerably higher than the rates I've proposed above. Also, they assume economic growth rates of 4 to 6% per year! We have hit 4% and higher only 9 years out of the last 32 years with the last time in 2000 according to World Bank data. In the last 10 years, we have only hit 3% growth on 3 occasions. Of course, with a realistic road map to a bring the deficits and debt under control, the economy may perform better thus reaching the balance point sooner.
Below is a graph generated from a CBO report of budget estimates for 2011 to 2021. As you can see the growth of the two lines is much steeper and yet the two lines do not meet. I was not able to figure out what their economic growth assumptions were. I'm sure it is in there somewhere but I didn't find it in a quick scan of the data table.
Suffice to say, I'd like to see the types of charts I'm generating here rather X number of dollar of tax increases and Y number of dollars in spending cuts reported in fiscal cliff negotiations. The cited numbers are always relative to some unstated "baseline." Instead, they ought to show absolute dollar charts like what I have here. Also, the fiscal cliff negotiators probably have unstated economic growth projections that are unrealistic. I just wish the politicians would just tell the truth about the numbers!
Politics: Balancing the budget is as "easy" as 1-2-4
Balancing the Federal budget is about bringing the revenue line up and the spending line down when measured against the GDP. When measured against absolute dollars amounts, it is about flatting the spending line and getting the revenue line going up a bit faster.
If the economy is growing at 2 to 4% but spending is growing at 5 to 7%, the deficits will continue and debt will pile up which has been occurring for the last decade under both Republican Bush and Democrat Obama administrations.
So fixing the deficit and thus getting the debt under control is as "easy" as 1-2-4.
Cap growth of government to 1% per year. Assume GDP growth at 2% per year. Raise revenue by 4% per year. Do this and the budget balances by 2027.
However you slice up the numbers, the growth rate of government MUST be lower than the growth rate of the economy or else we will be forever chasing our own tail. The reality is that the US economy has been growing at about 2% per year on average over the last couple of decades. Clinton era boom times hit around 4% for a few years. Assume inevitable booms and busts average out to 2% growth per year. Thus, growth in government spending must be LOWER than growth rate in the economy. We also should aim for 4% growth in the taxation side per year to speed up reaching balance.
1% growth in spending, 2% growth in the economy and 4% growth in taxation, you get to balance by 2027.
The math is easy. It is just plugging in numbers and you get to balance. You can tweak the exact combination of numbers but the spending growth rate has to be LESS than economic growth rate and the rise in taxation should be a gentle one since sudden increases cause panics. If the economy grows faster than 2% you get to balance sooner. If the economy grows slower than 2% but above 1% growth in spending you eventually get to balance, it just takes a few more years.
The problem is the political will to cap spending growth to 1% per year given that we have routinely been spending 5-7% more per year.
All the angst and sackcloth over the fiscal cliff is political gamesmanship. The mathematical road map to balance is actually rather straightforward.
The graphs that illustrate the 1-2-4 plan are below. First, in absolute dollars.

Second, in percent GDP.

P.S. Another way to look at it is to look at THREE key numbers:
(1) what % GDP we want government spending to be
(2) the year we want to reach that target
(3) assumption about economic growth.
In the above graphs, the target is 21% GDP by 2027 assuming 2% economic growth.
There are of course other possible scenarios, for example 20% GDP by 2030. The slope of the lines in that scenario would be a little different. One could aim for 19% GDP by 2020 and the slopes in those lines would be also a bit different.
The $16,000,000,000,000 question: if the White House had to pick a GDP number and a year, what would they pick? What numbers would the House Republican's pick? Of course, they would probably pick very different numbers! Would they split the difference?
The thing they probably would agree upon is overly optimistic economic growth assumptions which makes the effort pointless. Sigh.
P.P.S. I do like to read Dan Mitchell's stuff. I posted the above item before I saw this item over at Cato he wrote recently. In sum, Mitchell declares, Simply stated, even huge tax hikes won't stem the flow of red ink in the long run if government keeps growing faster than the private economy. This is the fiscal problem that demands attention. Alas, unfortunately, it would appear that the wisdom of a non-economist blogger in pajamas and a seasoned pro like Mitchell will get ignored just the same by the powers that be in the White House and the Hill.
If the economy is growing at 2 to 4% but spending is growing at 5 to 7%, the deficits will continue and debt will pile up which has been occurring for the last decade under both Republican Bush and Democrat Obama administrations.
So fixing the deficit and thus getting the debt under control is as "easy" as 1-2-4.
Cap growth of government to 1% per year. Assume GDP growth at 2% per year. Raise revenue by 4% per year. Do this and the budget balances by 2027.
However you slice up the numbers, the growth rate of government MUST be lower than the growth rate of the economy or else we will be forever chasing our own tail. The reality is that the US economy has been growing at about 2% per year on average over the last couple of decades. Clinton era boom times hit around 4% for a few years. Assume inevitable booms and busts average out to 2% growth per year. Thus, growth in government spending must be LOWER than growth rate in the economy. We also should aim for 4% growth in the taxation side per year to speed up reaching balance.
1% growth in spending, 2% growth in the economy and 4% growth in taxation, you get to balance by 2027.
The math is easy. It is just plugging in numbers and you get to balance. You can tweak the exact combination of numbers but the spending growth rate has to be LESS than economic growth rate and the rise in taxation should be a gentle one since sudden increases cause panics. If the economy grows faster than 2% you get to balance sooner. If the economy grows slower than 2% but above 1% growth in spending you eventually get to balance, it just takes a few more years.
The problem is the political will to cap spending growth to 1% per year given that we have routinely been spending 5-7% more per year.
All the angst and sackcloth over the fiscal cliff is political gamesmanship. The mathematical road map to balance is actually rather straightforward.
The graphs that illustrate the 1-2-4 plan are below. First, in absolute dollars.
Second, in percent GDP.
P.S. Another way to look at it is to look at THREE key numbers:
(1) what % GDP we want government spending to be
(2) the year we want to reach that target
(3) assumption about economic growth.
In the above graphs, the target is 21% GDP by 2027 assuming 2% economic growth.
There are of course other possible scenarios, for example 20% GDP by 2030. The slope of the lines in that scenario would be a little different. One could aim for 19% GDP by 2020 and the slopes in those lines would be also a bit different.
The $16,000,000,000,000 question: if the White House had to pick a GDP number and a year, what would they pick? What numbers would the House Republican's pick? Of course, they would probably pick very different numbers! Would they split the difference?
The thing they probably would agree upon is overly optimistic economic growth assumptions which makes the effort pointless. Sigh.
P.P.S. I do like to read Dan Mitchell's stuff. I posted the above item before I saw this item over at Cato he wrote recently. In sum, Mitchell declares, Simply stated, even huge tax hikes won't stem the flow of red ink in the long run if government keeps growing faster than the private economy. This is the fiscal problem that demands attention. Alas, unfortunately, it would appear that the wisdom of a non-economist blogger in pajamas and a seasoned pro like Mitchell will get ignored just the same by the powers that be in the White House and the Hill.
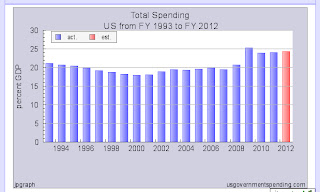
Politics: The Good Old Days of President Clinton?
There is a lot of talk about the fiscal cliff.
One thread in the conversation is that the tax rates will rise from the the Bush era rates back to the Clinton era rates and Democrats state that the Clinton era was an economic boom time. But will the Obama administration and his allies in Congress also lobby for Clinton era spending levels?
Indeed, revenue during the Clinton era ranged from 17-20% of GDP. I'm not an economist so I don't know how much of the rise in revenue was due to the increased tax rates and how much was due to the economy booming.
The spending during that same period ranged from 21-18%. Spending declined as Clinton worked with the GOP Congress to reduce overall spending of which a certain amount was the post-Cold War defense draw down.
Fast forward to where we are now where any deal on the Fiscal Cliff will probably involve an increase in taxes. The current talking point is tax rates should rise to Clinton era levels for those $250,000 and above. As such, unless we go over the fiscal cliff, we actually aren't getting back to the Clinton era rates Democrats lionize since those below $250,000 would be under Bush era tax rates.
Under a rosy economic boom scenario, revenue might rise to 20% of GDP which was at the top of the Clinton boom times.
What about the spending side?
We are now at 23-25% GDP. Thus, we would still run deficits of 3-5% of GDP. US GDP is about $15 trillion; therefore, $450-750 billion deficits will result.
If we want Clinton era tax revenues, we also need Clinton era spending levels, if we want to begin to make a dent on the Federal debt. The first part of this equation (increasing tax revenues) results in cheers. The second part of this equation (decreasing spending) results in the sound of crickets.
Update: Just came across this item from Dan Mitchell at Cato. Excerpt: You may have noticed that the White House used 20 percent of GDP as a benchmark in its chart, apparently because we should strive for the fiscal policy we had in Bill Clinton’s second term. I might be willing to take them up on that offer, so long as they’re also willing to accept Bill Clinton’s spending levels. More from Cato about the Clinton years.
World: Hewitt Interview of Author of "Little America"
Another interview spanning the full broadcast was with Rajiv Chandrasekaren who wrote Little America: the war within the war for Afghanistan.
Rajiv covers the good, bad and ugly of the US effort in Afghanistan. No question a lot of good intentions, bravery in the battlefield but sadly there was poor policy choices in the "nation building" project.
One particularly aggravating example was USAID unwillingness to help the Afghans grow cotton because the US wants to protect its cotton industry.
Another was authorization of the surge in Afghanistan but not sending enough troops and then pulling them out so quickly indicating that Washington was half-hearted about the effort.
World: Hugh Hewitt Interview of Jake Tapper Author of "The Outpost"
Hewitt devoted his entire broadcast to hearing the story behind "The Outpost."
The book gives a ground level view of the battle at Combat Outpost Keating in Afghanistan. But beyond the battle itself, Tapper delves into the people there - those who survived and those who didn't - and the people back home who love them. He also went into the history of the base leading up to the fateful battle. A story of incredible valor and infuriating decision making that left those troops in such a precarious location.
Riveting radio.
Here is a video clip from Jake Tapper on his book tour launch explaining how he got started on writing the book.
Watch More News Videos at ABC
|
2012 Presidential Election
|
Entertainment & Celebrity News
Here is another clip from the same book tour launch with remarks from some of the soldiers profiled in the book.
Watch More News Videos at ABC
|
2012 Presidential Election
|
Entertainment & Celebrity News
Business: Twilight for Twinkie & the Auto Bailout
The latest mediation effort has failed and as such a court supervised liquidation appears to be the next step. Companies will probably buy up some of the Hostess brands and facilities. Will be interesting to see what survives and what doesn't and in what form.
Hostess employed 18,500 people.
A handful of years ago, GM and Chrysler was essentially in a similar position: unable to pay its bills, too many unprofitable brands, costly union contracts and excess capacity. But since that industry employed so many more people, the pressure to bail them out was tremendous. The Federal government bailed them out at a cost that is still uncertain despite claims it was a success. Here is a video that explored some of the problems of the bailout beyond taxpayer cost including favoritism to unions, business decisions driven by political considerations instead of economic ones and moral hazard.
One wonders how would things have unfolded if GM and Chrysler had gone through traditional bankruptcy court?
Business: Twilight for Twinkies
I have to say I ate them as a kid but not often and haven't had one in decades.
But in any case, Hostess bakery is going out of business and the union blames management and management blames the unions.
If indeed, management was lousy, a company will buy some of the assets of Hostess that are profitable and some of the union jobs will be restored.
But I suspect as more and more Americans are health conscious about eating habits, Hostess successor company will have to change their product line quite a bit.
As for AFL-CIO President Trumka's attack on Hostess, Bain and Mitt Romney: it is emotionalism and disconnected from economic reality. His charges against mis-management of the company probably has some validity but the changing marketplace which the leadership probably failed to respond adequately to and union demands probably pushed the company over the brink.
On a broader question of unions, the one big difference between a union in the private sector and the public sector is that the private sector company may go belly up if it can't meet the union's negotiating position. Thus, a union in the private sector can only push so hard before the company just goes out of business.
In the case of the public sector union, the government can raises taxes to meet the public sector union's demands. But eventually, there are limits to that too as some city, county and state governments are having their finances pushed to the brink to meet public sector union contracts. The problem is that in this case, the fallout hit everyone taxpayer and is not just limited to the company, its workers and investors.
Politics: The press can dig up stuff when it really wants to
Wow, that was fast.
The news broke about the Gen. Petraeus scandal and now a torrent of news stories have come out since.
Meanwhile, over 2 months ago, 4 Americans were killed in Benghazi and the story of what really was going on before, during and after the attack still remains somewhat opaque such that Sen. McCain has called for a Congressional inquiry which probably won't happen because everyone is focused on the Petraeus scandal and the Fiscal Cliff.
The media likes to think of itself as the watchdog of those in power and revealers of the truth but here is an example where they go after the stories they like: sex and generals instead of why there are dead diplomats.
Some used to call Reagan the Teflon President but I think these past four years have shown the Obama should have that title.
UPDATE: Heard that President Obama will be holding a press conference. Will be interesting to see how dogged the questioning will be on the various topics.
PS: Of course, the timing of everything does feed into the perception of cover-up.
Politics: What is the "Fiscal Cliff?"
There is a lot of talk about the "fiscal cliff" and that we should NOT go off it at the beginning of 2013.
As I listen, I've been trying to figure out what this thing we should avoid really is?
From what I gather:
(1) On the revenue side, Bush era tax rates will revert to previous rates resulting in a $500 billion tax increase next year.
(2) On the spending side, the sequester will cut non-defense discretionary spending, around $54.5 billion
(3) On the spending side, the sequester will cut defense spending, around $54.5 billion.
The fear is that going over the cliff will return the USA into a recession.
This item in the WaPo describes what might happen if nothing is done and also describes the political incentives each interest group has in wanting to go over the fiscal cliff.
In brief:
One group thinks taxes are too low and so they want item #1 to happen and will live with item #2 and item #3.
One group wants all spending to be cut and like items #2 & 3 and will live with item #1.
One group wants defense spending cut (item #3) and will live with item #1 & 2.
Is it possible that the best compromise is to actually go over the "fiscal cliff" as suggested by libertarian policy analyst Veronique de Rugy?
Within Congress, there are probably people in all three groups who despite their indicating something needs to be done would not mind the fiscal cliff because they will get something they want.
And which group would the White House be most sympathetic too?
Of course, both Speaker Boehner and President Obama have indicated they want to make some kind of deal.
Question: what can all three interest groups accept that is NOT the fiscal cliff scenario?
Of course, there is also the "kick the can" resolution: no changes in the tax rates and cancel the sequester.
Politics: the Power of Voter Turnout
I've understood in the abstract that if you can turnout your voters you can win.
From the election day numbers, there was a D+6 turnout and Romney took independents by 5 and President Obama won re-election handily.
Show me the numbers:
Plugging in the numbers described above along with some other bits of information I've heard regarding the exit polls, you get a 3% win.
How much would the turnout need to change in order to tip the balance?
Scenario 2 has D+2.
If you had scenario 1 (D+6), how many independents would you need to win to change the outcome?
That is scenario 3 where Romney would have won if he could win independents by 16%.
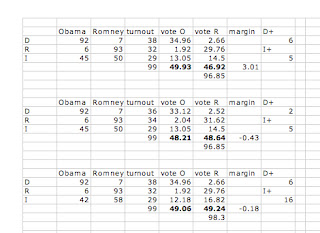 Suffice to say, it is probably easier (though not easy) to bring the D+6 down to D+2 than to move independents from +5 to +16!
Now, I can see why they say, it is all about turnout.
From the election day numbers, there was a D+6 turnout and Romney took independents by 5 and President Obama won re-election handily.
Show me the numbers:
Plugging in the numbers described above along with some other bits of information I've heard regarding the exit polls, you get a 3% win.
How much would the turnout need to change in order to tip the balance?
Scenario 2 has D+2.
If you had scenario 1 (D+6), how many independents would you need to win to change the outcome?
That is scenario 3 where Romney would have won if he could win independents by 16%.
Now, I can see why they say, it is all about turnout.
Politics: The Day After the Election, Part II
As an observer of the political process, I spent the last week making a series of post about swing state polling and the electoral college.
My three take aways are marked in bold.
In polling, the perspective is "polls are generally right unless they aren't" and last night, they were generally right.
There were reasons, which I went into, as to why the polling might have been mis-reading the public but in the end the state level polling that showed a comfortable lead for the President turned out to be correct and the national level polling that showed a close race plus/minus 1% turned out to be within the margin of error and correct as the President will clear about a 2% popular vote victory.
It was thought that it was unlikely that Obama's turnout would be as strong as 2008 and that Romney's turnout would improve on McCain's. The question was whether the combination of increase on one side and decrease on the other would change the outcome.
In 2008, Obama received 69.5 million votes compared to McCain's 59.9 million.
The 2012 figure at the moment (noon Wednesday) has Obama at 60 million and Romney at 57 million. The final figures will take a few more days to tabulate.
Thus, at this point, Obama support declined a fair amount but Romney support also declined resulting in a closer race but the outcome not all that different from 2008 which raises major questions for the Republican party.
This became clear when Florida, North Carolina and Virginia stayed too close to call early in the evening. These were the most fertile ground to Romney and if he couldn't win those outright there would have been no reason to believe Romney could breakthrough in the mid-west and get to 270.
My final political take-away is that the Electoral College remains a net positive for the political process.
The popular vote differential is about 2% which is not a big difference but people will remember the electoral college differential which is politically beneficial going forward. Whether the Founding Fathers had this feature in mind, I don't know, but this "crazy" and "quirky" device reveals and amplifies the edge in support the President has in a wider range of states.
Politics: The Day After Election Day, Part I
As a citizen of the USA, I knew, regardless of who would win the election last night, our country faces a number of serious challenges and heavy responsibilities would be upon those elected. As a Romney-Ryan supporter, I was disappointed but not surprised by the outcome. Before I called it a night last night, these were my thoughts:
Congratulations to President Obama on his re-election.
Thank you Gov. Romney for expressing the views of many in our nation.
My prayer for our nation: "Lord, we commend this nation to your merciful care. Guide us that we may dwell in peace. Grant to the President of the United States and to all in authority, wisdom and strength to know and to do justice and love mercy and to serve with humility. Fill them with love of truth and righteousness. Make them ever mindful of their calling to serve the people with reverence to You through Jesus Christ our Lord, amen.
I think the prayer I wrote down would have probably been the same if Mr. Romney had been elected.
Politics: Election Day In America
Got to my polling place 10 minutes before opening at 7AM. By the time, the poll worker announced, "The polls are open," there were 20 in line. I got in and marked my ballot with the ink-a-vote pen and feed it into the reader. My ballot was the second one cast.
All across America, this civic ritual is taking place in fire stations, homes, schools, church gyms and condo/apartment recreation rooms.
As one born in the USA, I've known this opportunity since I was 18. This morning, I think about those new citizens and the excitement they feel the first time they cast a ballot. For some in this world, casting a vote is a charade for dictators to say they have 99% of the support of their people. For some in this world, the possibility doesn't even exist.
Let us take on this responsibility with gratitude and sober mind. And let us offer up a prayer for those elected to govern whether we voted for them or not.

Politics: Electoral College Project November 201
If the state polling aggregate numbers at RCP are correct:

What if the state polls are under-reporting GOP strength by 1% and undecideds break 2-to-1 for the challenger?
Method:
1. Using the RCP state poll averages for data (O, R)
2. R1 = R*1.01 adjusts for tendency of polls to under-sample Republican voters - this is a debated assumption about systemic error in polling
3. und = O - R1 this is the percent undecided voters
4. O1 = O + (und*0.3333) and R2 = R1 + (und*0.6667) accounts for the debated assumption that undecided voters break 2-to-1 for the challenger
5. O1 + R2 to check to see if the numbers add up to 100%
6. O1 - R2 yields the final vote in that state; a negative value means Gov. Romney wins that state while a positive value means President Obama wins that state
7. EV is the electoral vote value of the state
8. O-EV and R-EV gives the various electoral college totals for the candidates if they hold/lose that state.
Result: President Obama 281 Gov. Romney 257

In order for the state polling data to show a Romney victory, the existing data needs to be under-estimating Republican support by 6.4% resulting in the table below which resembles Electionprojection.com's 2008/2004 average turnout model.

Poll pros who really do this seriously:
538 (315-223 Obama)
electoral-vote.com (294-220 Obama with 24 too close to call)
electionprojection.com (303-235 Obama)
I'm just a "blogger in pajamas" but why should they have all the fun?
The Romney people are either actually confident of their chances or they are putting on a very brave face. Geraghty offers up two items today that explain their confidence (actual or spin).
So as it stands:
1) If the state polling is accurate, the President is headed toward around 300 electoral votes and easy win.
2) If the national polling is accurate, the race is very close (on par with 1976, 2000, 2004) and the winner will probably get something in between 270-290 electoral votes.
3) It is theoretically possible that a candidate could just barely win the popular vote and collect a sizable electoral college win consistent with both sets of polling data.
As an extreme hypothetical, if a candidate won every state by 0.5%, there could be a 538-0 electoral college shutout with only a 0.5% popular vote differential. However, in practice, that is unlikely.
I went to the databank and plotted the data of the electoral votes of the winning candidate (y-axis) and the popular vote differential (x-axis). I went back only to 1964 because that was the first time the electoral college totaled 538. I dropped the 1968 election data point because there were some electors that cast their ballots for a 3rd party candidate (46 for George Wallace) which was the last time that occurred in numbers beyond the occasional lone protesting faithless elector.

As you can see, there is a somewhat linear relationship between margin and total electoral votes. There were three obvious exceptions where the electoral vote margin was disproportionate to the popular vote margin (1980, 1984, 1988). You can also see that we have very little data points on the left side of the graph. The three closest races occurred in 1976, 2000 and 2004. 2012 looks to be on that side of the graph.
Carter had a 2% popular vote margin in 1976 yielding 297 electoral votes, thus, a 1% win by either Obama or Romney would likely yield electoral votes less than 297. However, the design of the electoral college permits a narrow popular vote win to be magnified because a candidate gained support from a larger collection of states. This benefit would be lost in a popular vote only system which Democrats generally support because of their 2000 experience. Ironically, if indeed Obama gets ~ 300 EVs but only wins the popular vote by 0.5 to 1%, his political standing is enhanced by the "quirky" electoral college because he can claim his support was over a larger number of states.
What if the state polls are under-reporting GOP strength by 1% and undecideds break 2-to-1 for the challenger?
Method:
1. Using the RCP state poll averages for data (O, R)
2. R1 = R*1.01 adjusts for tendency of polls to under-sample Republican voters - this is a debated assumption about systemic error in polling
3. und = O - R1 this is the percent undecided voters
4. O1 = O + (und*0.3333) and R2 = R1 + (und*0.6667) accounts for the debated assumption that undecided voters break 2-to-1 for the challenger
5. O1 + R2 to check to see if the numbers add up to 100%
6. O1 - R2 yields the final vote in that state; a negative value means Gov. Romney wins that state while a positive value means President Obama wins that state
7. EV is the electoral vote value of the state
8. O-EV and R-EV gives the various electoral college totals for the candidates if they hold/lose that state.
Result: President Obama 281 Gov. Romney 257
In order for the state polling data to show a Romney victory, the existing data needs to be under-estimating Republican support by 6.4% resulting in the table below which resembles Electionprojection.com's 2008/2004 average turnout model.
Poll pros who really do this seriously:
538 (315-223 Obama)
electoral-vote.com (294-220 Obama with 24 too close to call)
electionprojection.com (303-235 Obama)
I'm just a "blogger in pajamas" but why should they have all the fun?
The Romney people are either actually confident of their chances or they are putting on a very brave face. Geraghty offers up two items today that explain their confidence (actual or spin).
So as it stands:
1) If the state polling is accurate, the President is headed toward around 300 electoral votes and easy win.
2) If the national polling is accurate, the race is very close (on par with 1976, 2000, 2004) and the winner will probably get something in between 270-290 electoral votes.
3) It is theoretically possible that a candidate could just barely win the popular vote and collect a sizable electoral college win consistent with both sets of polling data.
As an extreme hypothetical, if a candidate won every state by 0.5%, there could be a 538-0 electoral college shutout with only a 0.5% popular vote differential. However, in practice, that is unlikely.
I went to the databank and plotted the data of the electoral votes of the winning candidate (y-axis) and the popular vote differential (x-axis). I went back only to 1964 because that was the first time the electoral college totaled 538. I dropped the 1968 election data point because there were some electors that cast their ballots for a 3rd party candidate (46 for George Wallace) which was the last time that occurred in numbers beyond the occasional lone protesting faithless elector.
Carter had a 2% popular vote margin in 1976 yielding 297 electoral votes, thus, a 1% win by either Obama or Romney would likely yield electoral votes less than 297. However, the design of the electoral college permits a narrow popular vote win to be magnified because a candidate gained support from a larger collection of states. This benefit would be lost in a popular vote only system which Democrats generally support because of their 2000 experience. Ironically, if indeed Obama gets ~ 300 EVs but only wins the popular vote by 0.5 to 1%, his political standing is enhanced by the "quirky" electoral college because he can claim his support was over a larger number of states.
Non-profit of the Month: November 2012 - Americares
When disaster strikes, and Hurricane Sandy definitely fits the description of a large scale disaster, there are a handful of groups that are large enough and have the experience to get moving quickly. One that I have donated to in times like these is Americares.
Hope you will take a break for all the political news and find a group you can donate to and help our fellow Americans in this time of great need.
Hope you will take a break for all the political news and find a group you can donate to and help our fellow Americans in this time of great need.
Politics: Electoral College Forecast for Nov 2012
Method:
1. Using the RCP state poll averages for data (O, R)
2. R1 = R*1.01 adjusts for tendency of polls to under-sample Republican voters - this is a debated assumption about systemic error in polling
3. und = O - R1 this is the percent undecided voters
4. O1 = O + (und*0.3333) and R2 = R1 + (und*0.6667) accounts for the debated assumption that undecided voters break 2-to-1 for the challenger
5. O1 + R2 to check to see if the numbers add up to 100%
6. O1 - R2 yields the final vote in that state; a negative value means Gov. Romney wins that state while a positive value means President Obama wins that state
7. EV is the electoral vote value of the state
8. O-EV and R-EV gives the various electoral college totals for the candidates if they hold/lose that state.

Result: President Obama 281 Gov. Romney 257
Poll pros who really do this seriously:
538 (306-232, Obama)
electoral-vote.com (281-206, Obama, 51 too close to call)
electionprojection.com (290-248, Obama)
I'm just a "blogger in pajamas" but why should they have all the fun?
The reputation of some pollsters is on the line.
Today, a poll in Michigan has Romney up one while everyone else has Obama with leads of various sizes. A Republican presidential candidate has not won Michigan since 1988. Thus, if this pollster is right, there is a huge Romney wave out there. There is a poll that is a few days old on Pennsylvania voters that has it tied. Pennsylvania has not gone to the GOP also since 1988. One pollster has Wisconsin tied and Wisconsin hasn't gone Republican since 1984.
It is entirely possible that these pollsters are outliers and Obama's situation is perfectly fine in the "midwestern firewall" (the above 3 mentioned states) and thus he is on his way to a narrow but clear re-election. But if these outlier pollsters have detected a shift, it is likely that it is a nation-wide shift given that these three states are traditionally Democratic.
In summary:
(1) The national poll data, as is, suggests a close popular vote race and probably Ohio as the decider. It plays out thusly: Romney gets the Atlantic 3 (Florida, Virginia, North Carolina) and 248; Obama gets the Midwest Firewall (Pennsylvania, Michigan, Wisconsin) and 247; Romney and Obama split the Swingy 4 (Colorado, Nevada, New Hamphire, Iowa) yielding at least 10 and as high as 15 electoral votes for each side; leaving the election to Ohio and its 18 electoral votes to decide the Presidency.

(2) If some of the midwestern firewall is actually in play and Romney actually breaks through (for example Wisconsin) then the vast majority of the pollsters will have egg on their faces. Under this scenario, Romney will probably also win Iowa, Colorado and New Hampshire that are already more favorable to Romney. In fact, a Wisconsin/Iowa/Colorado/New Hampshire combo makes up for the loss of Ohio.


1. Using the RCP state poll averages for data (O, R)
2. R1 = R*1.01 adjusts for tendency of polls to under-sample Republican voters - this is a debated assumption about systemic error in polling
3. und = O - R1 this is the percent undecided voters
4. O1 = O + (und*0.3333) and R2 = R1 + (und*0.6667) accounts for the debated assumption that undecided voters break 2-to-1 for the challenger
5. O1 + R2 to check to see if the numbers add up to 100%
6. O1 - R2 yields the final vote in that state; a negative value means Gov. Romney wins that state while a positive value means President Obama wins that state
7. EV is the electoral vote value of the state
8. O-EV and R-EV gives the various electoral college totals for the candidates if they hold/lose that state.
Result: President Obama 281 Gov. Romney 257
Poll pros who really do this seriously:
538 (306-232, Obama)
electoral-vote.com (281-206, Obama, 51 too close to call)
electionprojection.com (290-248, Obama)
I'm just a "blogger in pajamas" but why should they have all the fun?
The reputation of some pollsters is on the line.
Today, a poll in Michigan has Romney up one while everyone else has Obama with leads of various sizes. A Republican presidential candidate has not won Michigan since 1988. Thus, if this pollster is right, there is a huge Romney wave out there. There is a poll that is a few days old on Pennsylvania voters that has it tied. Pennsylvania has not gone to the GOP also since 1988. One pollster has Wisconsin tied and Wisconsin hasn't gone Republican since 1984.
It is entirely possible that these pollsters are outliers and Obama's situation is perfectly fine in the "midwestern firewall" (the above 3 mentioned states) and thus he is on his way to a narrow but clear re-election. But if these outlier pollsters have detected a shift, it is likely that it is a nation-wide shift given that these three states are traditionally Democratic.
In summary:
(1) The national poll data, as is, suggests a close popular vote race and probably Ohio as the decider. It plays out thusly: Romney gets the Atlantic 3 (Florida, Virginia, North Carolina) and 248; Obama gets the Midwest Firewall (Pennsylvania, Michigan, Wisconsin) and 247; Romney and Obama split the Swingy 4 (Colorado, Nevada, New Hamphire, Iowa) yielding at least 10 and as high as 15 electoral votes for each side; leaving the election to Ohio and its 18 electoral votes to decide the Presidency.
(2) If some of the midwestern firewall is actually in play and Romney actually breaks through (for example Wisconsin) then the vast majority of the pollsters will have egg on their faces. Under this scenario, Romney will probably also win Iowa, Colorado and New Hampshire that are already more favorable to Romney. In fact, a Wisconsin/Iowa/Colorado/New Hampshire combo makes up for the loss of Ohio.
(3) If the state polling data is correct, there is no under-reporting of GOP strength and the undecideds go 50/50 in the final days then the result is an easy re-election.
Politics: 2012 Electoral College Projections
Method:
1. Using the RCP state poll averages for data (O, R)
2. R1 = R*1.01 adjusts for tendency of polls to under-sample Republican voters - this is a debated assumption about systemic error in polling
3. und = O - R1 this is the percent undecided voters
4. O1 = O + (und*0.3333) and R2 = R1 + (und*0.6667) accounts for the debated assumption that undecided voters break 2-to-1 for the challenger
5. O1 + R2 to check to see if the numbers add up to 100%
6. O1 - R2 yields the final vote in that state; a negative value means Gov. Romney wins that state while a positive value means President Obama wins that state
7. EV is the electoral vote value of the state
8. O-EV and R-EV gives the various electoral college totals for the candidates if they hold/lose that state.
Result: President Obama 275 Gov. Romney 263

electoral-vote.com
electionprojection.com
I'm just a "blogger in pajamas" but why should they have all the fun?
The discussion within polling circles this year is whether there is systematic under-sampling of GOP support. Barone believes the polling data is so far off that he is actually calling for a large easy win for Romney.
Why do I think GOP strength is under-detected at some small but definite amount?
(1) During the 1996 campaign Clinton was expected to easily surpass 50% and defeat Dole by double digit percentages in the popular vote. The final numbers were 49.23% to 40.72% which indicated the polls overstated Clinton support. In that election, it didn't matter because it wasn't close enough for that over-estimation to matter.
(2) In looking at the 2004 RCP averages, more polls underestimated the Bush victory margin than over-estimated and in the aggregated numbers showed a differential 0.9% below the actual margin.
(3) In a much weaker under-detection, the 2008 RCP data showed the polls doing pretty well being off in the average by only 0.3% in the differential in favor of the Democrats.
(4) In the context of the 2012 election cycle, in the Wisconsin Gov. Scott Walker recall, the polls consistently under-estimated GOP turnout.
We shall have an answer Tuesday November 6 as to (1) whether the undersampling has been occurring this cycle and (2) if so, what degree. Both have to be true for Romney to even have a chance to win.
1. Using the RCP state poll averages for data (O, R)
2. R1 = R*1.01 adjusts for tendency of polls to under-sample Republican voters - this is a debated assumption about systemic error in polling
3. und = O - R1 this is the percent undecided voters
4. O1 = O + (und*0.3333) and R2 = R1 + (und*0.6667) accounts for the debated assumption that undecided voters break 2-to-1 for the challenger
5. O1 + R2 to check to see if the numbers add up to 100%
6. O1 - R2 yields the final vote in that state; a negative value means Gov. Romney wins that state while a positive value means President Obama wins that state
7. EV is the electoral vote value of the state
8. O-EV and R-EV gives the various electoral college totals for the candidates if they hold/lose that state.
Result: President Obama 275 Gov. Romney 263
Poll pros who really do this seriously:
538
electoral-vote.com
electionprojection.com
I'm just a "blogger in pajamas" but why should they have all the fun?
The discussion within polling circles this year is whether there is systematic under-sampling of GOP support. Barone believes the polling data is so far off that he is actually calling for a large easy win for Romney.
Why do I think GOP strength is under-detected at some small but definite amount?
(1) During the 1996 campaign Clinton was expected to easily surpass 50% and defeat Dole by double digit percentages in the popular vote. The final numbers were 49.23% to 40.72% which indicated the polls overstated Clinton support. In that election, it didn't matter because it wasn't close enough for that over-estimation to matter.
(2) In looking at the 2004 RCP averages, more polls underestimated the Bush victory margin than over-estimated and in the aggregated numbers showed a differential 0.9% below the actual margin.
(3) In a much weaker under-detection, the 2008 RCP data showed the polls doing pretty well being off in the average by only 0.3% in the differential in favor of the Democrats.
(4) In the context of the 2012 election cycle, in the Wisconsin Gov. Scott Walker recall, the polls consistently under-estimated GOP turnout.
We shall have an answer Tuesday November 6 as to (1) whether the undersampling has been occurring this cycle and (2) if so, what degree. Both have to be true for Romney to even have a chance to win.
Politics: 2012 Electoral College Projections
Method:
1. Using the RCP state poll averages for data (O, R)
2. R1 = R*1.01 adjusts for tendency of polls to under-sample Republican voters - this is a debated assumption about systemic error in polling
3. und = O - R1 this is the percent undecided voters
4. O1 = O + (und*0.3333) and R2 = R1 + (und*0.6667) accounts for the debated assumption that undecided voters break 2-to-1 for the challenger
5. O1 + R2 to check to see if the numbers add up to 100%
6. O1 - R2 yields the final vote in that state; a negative value means Gov. Romney wins that state while a positive value means President Obama wins that state
7. EV is the electoral vote value of the state
8. O-EV and R-EV gives the various electoral college totals for the candidates if they hold/lose that state.
Result: President Obama 275 Gov. Romney 263
Poll pros who really do this seriously:
538
electoral-vote.com
electionprojection.com
I'm just a "blogger in pajamas" but why should they have all the fun?
If one takes the state level polling at face-value or even using the modest adjustments I described above, the President will be re-elected. Some pundits are saying that the polls are systematically under-sampling GOP support. Using the above data, one would have to incorporate a 4% adjustment to the strength of Romney support in order to yield a Romney electoral college victory.
Politics: Nov 2012 for Culver City Voters Measure Y
Had the chance to hear the mayor of Culver City (Weissman) and one of the council members (Clarke) talk about Measure Y, a sales tax increase that will help help get the city budget in balance.
The two speakers pointed out that cuts have been made in the city workforce and pension commitments renegotiated but that the hole in the budget from the end of redevelopment agency funds and economic downturn was still eating into the city's reserves because of a structural deficit.
Here it an op-ed from the vice-mayor Cooper.
Culver City is a relatively small city of 40,000 and much of the budget goes to basic services like police, fire, sanitation, transportation and parks. The rise in sale tax will leave Culver City with rates comparable to neighboring cities. Additionally, the sale tax has a sunset provision (10 years) and could be rescinded by a vote of the city council.
The measure received support from the Culver City Chamber of Commerce.
I'll be voting Yes on Y.
UPDATE: The LATimes published a report on 11/5/12 that Mayor Weissman owes a sizable amount of back taxes. It will be interesting to see if this late breaking news hurts the Yes on Y campaign. Certainly, Culver City residents will probably want to hear more from Weissman about the situation beyond the very terse comments related in the LA Times article.
Politics: Nov 2012 LA County - Measure J?
Measure R passed a few years back raising sales tax for 30 years to fund transportation projects.
Measure J on the Nov 2012 ballot for LA County voters will extend that sales tax for an additional 30 years. This extension will permit the County to borrow money in the next decade and use the future revenues to help pay off the debts.
LA Weekly has a good summary of the pros and cons.
I'm leaning toward a NO vote on this item.
Politics: Taking a guess at the 2012 electoral college outcome
Method:
1. Using the RCP state poll averages for data (O, R)
2. R1 = R*1.01 adjusts for tendency of polls to under-sample Republican voters - this is a debated assumption about systemic error in polling
3. und = O - R1 this is the percent undecided voters
4. O1 = O + (und*0.3333) and R2 = R1 + (und*0.6667) accounts for the debated assumption that undecided voters break 2-to-1 for the challenger
5. O1 + R2 to check to see if the numbers add up to 100%
6. O1 - R2 yields the final vote in that state; a negative value means Gov. Romney wins that state while a positive value means President Obama wins that state
7. EV is the electoral vote value of the state
8. O-EV and R-EV gives the various electoral college totals for the candidates if they hold/lose that state.
Result: President Obama 271 Gov. Romney 267

Poll pros who really do this seriously:
538
electoral-vote.com
electionprojection.com
I'm just a "blogger in pajamas" but why should they have all the fun?
1. Using the RCP state poll averages for data (O, R)
2. R1 = R*1.01 adjusts for tendency of polls to under-sample Republican voters - this is a debated assumption about systemic error in polling
3. und = O - R1 this is the percent undecided voters
4. O1 = O + (und*0.3333) and R2 = R1 + (und*0.6667) accounts for the debated assumption that undecided voters break 2-to-1 for the challenger
5. O1 + R2 to check to see if the numbers add up to 100%
6. O1 - R2 yields the final vote in that state; a negative value means Gov. Romney wins that state while a positive value means President Obama wins that state
7. EV is the electoral vote value of the state
8. O-EV and R-EV gives the various electoral college totals for the candidates if they hold/lose that state.
Result: President Obama 271 Gov. Romney 267
538
electoral-vote.com
electionprojection.com
I'm just a "blogger in pajamas" but why should they have all the fun?
Politics: States to Watch on Election Night
If Obama wins the same states as in 2008 = 358 electoral votes.
I list the states Obama might lose with the top ones most likely and the bottom ones least likely.
Lose Indiana (11) = 347
Lose North Carolina (15) = 332
Lose Florida (29) = 303
Lose Virginia (13) = 290
Lose Colorado (9) = 281
Lose New Hampshire (4) = 277
Lose Iowa (6) = 271
Lose Ohio (18) = 253
Lose Nevada (6) = 247
Lose Wisconsin (10) = 237
Lose Pennsylvania (20) = 217
Lose Michigan (16) = 201
Remember, 270+ out of 528 electoral votes are needed win the Presidency.
Be sure to watch the key Atlantic states: Virginia, North Carolina and Florida. There is no realistic scenario where the President loses re-election if he holds onto any of these three.
The President's mid-west firewall: Wisconsin, Pennsylvania and Michigan. If Romney wins any of those three, the undecideds have clearly broken strongly to him.
If the President's mid-west firewall holds up and Romney sweeps the three Atlantic states, then Ohio will put either side over the top.
It is mathematically possible that the President wins Ohio but loses Colorado, Iowa, Nevada and New Hampshire and falls short with 265 or that Romney wins Ohio but loses Colorado, Iowa, Nevada and New Hampshire and only gets to 266. But most likely, whoever wins Ohio will win at least one of the other four closely contested states.
Politics: What happens if the late deciders decide for the challenger?
The polls are close.
Some have Romney ahead and some have President Obama ahead.
The "conventional wisdom" is that if a voter is undecided they are more likely to vote for the challenger. Thus, let's assume for the purpose of discussion that 6 of 10 voters will vote for the challenger if they decide in the final weekend before the vote.
The Politico 10/22-10/25 poll has: Obama at 49 and Romney at 48.
Thus, there are 3% undecided.
If the 60/40 rule holds, then Obama will add 1.2% to his totals and Romney will get 1.8% more.
Final result: Obama 50.2% Romney 48.8%.
This scenario would probably mean a very long election night and possibly many days of counting absentee ballots and perhaps recounts in some swing states.
In the IBD 10/22-10/27 poll, Obama has 45 and Romney at 44.
Thus, 11% undecided.
If the 60/40 rule holds, then Obama adds 4.4% and Romney 6.6%.
Final result: Romney 50.6% Obama 49.4%.
Again, likely a very long night with a possible Romney popular vote win but an Obama re-election because the electoral votes are determinative.
On the other hand, if the Gallup 10/22-10/28 poll is right: Romney 51 Obama 46.
Thus, 3% undecided.
Final result: 51+1.8 = 52.8 Romney and 46+1.2 = 47.2 Obama.
A 5.6% popular vote differential would probably translate into a solid electoral college win with Romney probably right around 300.
So the key numbers:
(1) How many undecided there really are: 3% or 11%?
(2) If 3% then is the level of support for the President closer to 49 or 46?
(3) Will late deciders break toward Romney 60/40?
The three polls above have different readings on items #1 and #2. Of the two polls that agree the undecideds are only 3%, they differ on the level of support for the President.
Poll fans may note my omitting Rasmussen. Rasmussen is very close to Gallup as of 10/31 with Obama at 47% and 4% undecided. I wanted to highlight three very different polling scenarios.
Nate Silver appears to hold to the view that the polls point to about 3% undecided, the President's support at 49 to 50% (like Politico) and that the undecideds will probably split 50/50 yielding a popular vote of 50.5 to 51.5% and a comfortable electoral college win for the President. He also gives more weight to aggregating the state based polls over the national polls.
Electionprojection.com, like Nate Silver, also attempts to aggregate the polling data and come up with a forecast of what will happen and his model also predicts an Obama victory. However, he does point out the key is the turnout model. If the current polling data is adjusted to a 2004 turnout model or even a model somewhere in between 2004 and 2008, Romney wins. But if the data is taken as is, Obama wins. He puts it this way: Either the polls will be right and so will EP, or they'll be wrong and Romney will win the White House.
Jay Cost thinks the key polling number is Romney's edge on the economy and among independents.
Keep in mind, in the end, about 120 million votes will have been cast for president. A reported poll is on the order of 500 to 3000 people which forms a sample to assess possible outcomes in a state or national context. When they report a margin of error of 3%, that means a 51 to 49 lead could really be a 54 to 46 lead or a 48-52 deficit. Also, there is a 5% chance that the actual results will fall outside the stated range.
In 1984, 1988, 1992, 1996 and 2008, the polls all pointed to easy wins and the only question was what will be the final margin of victory. In 2000 and 2004, the polls were all very close and exit polling that major new outlets used on election night turned out to be problematic. Barring any last minute surprises, 2012 is looking to be very close.
November 6 may tell the tale. But if it is really, really close, there could be additional days of counting and recounting and we won't have an answer until several days later.
Non-profit of the month: October 2012 - Los Angeles Philharmonic
I'm a patron of the arts!
Okay, not a million dollar donor type of patron who gets a name stenciled on something in the building or printed in the program books. But, as a subscriber to the LA Phil since 1999, I've attend usually 4 concerts a year with them. And as a result, I've come to enjoy what they do and am happy to know the organization has a footprint in bringing music to youth and the community beyond the iconic Walt Disney Concert Hall venue.

Okay, not a million dollar donor type of patron who gets a name stenciled on something in the building or printed in the program books. But, as a subscriber to the LA Phil since 1999, I've attend usually 4 concerts a year with them. And as a result, I've come to enjoy what they do and am happy to know the organization has a footprint in bringing music to youth and the community beyond the iconic Walt Disney Concert Hall venue.

Politics: Cal Ballot Propositions for November 2012
Propositions 30 to 40 is a lot to sift through and below are some preliminary thoughts on how I'm leaning on the ballot measures. I welcome input as I reserve the right to change my mind right up to election day when I finally mark my ballot.
Let's take the easy one first ...
Prop 40 is the easiest with a YES vote.
Prop 40 is a yes/no vote on the new state senate district lines drawn up as a result of the 2010 census. There is no opposition to Prop 40 in any newspaper editorial board or major political party.
The rest are a bit more complicated and as I read through them and form a view, I'll post them below.
Vote NO on Prop 37.
Vote YES on Prop 36.
The three-strikes law has broad support and this proposition modifies it in ways that make sense: if the third-strike conviction is not in the category of a serious or violent crime then the heavy punishment required in the current law doesn't apply. This revision to the three-strikes law is supported by all six newspaper editorial boards I checked.
Vote ??? on Prop 35 - leaning toward a NO.
Human trafficking is a terrible crime. Law enforcement should do all it can to stop it. Since Prop 35 claims to fight human trafficking it is likely to gain a lot of support. But is the ballot measure well thought out?
Its a good cause but there is some doubt the measure will actually address the problem. The LA Times and Sacramento Bee came out against Prop 35. The Bee gave its reasons: It's difficult to oppose Proposition 35, a measure that purports to stop a crime as despicable as human trafficking. But the proposition is overbroad and misdirected. The LA Times gave similar reasons: Sex trafficking of minors is a real problem. There is evidence that in Southern California, gangs that once sold drugs are turning now to forced prostitution, especially of vulnerable girls (and sometimes boys) in foster care. Effectively targeting the problem requires carefully crafted and thoughtful laws that keep pace with the constantly changing practices in the shadowy world of human exploitation. Proposition 35 is not equal to the task. However, four other newspaper editorial boards came out in favor as did BOTH the Democrat and Republican parties. The OC Register's endorsement also noted some of the problems with the ballot measure but gave its endorsement despite those reservations. KPCC Airtalk had the two sides on their October 16 show. The supporter of Prop 35 was a prosecutor and the opponent was a sponsor of the current human trafficking laws that are on the books already in California.
How would you vote on such an item?
Have to say, when I am in doubt, I tend to vote no.
NO on Prop 34.
This proposition ends the death penalty in California. If you oppose the death penalty for whatever reasons, the choice is rather obvious. But those who support the death penalty but find the current system unworkable may be tempted to support this proposition figuring what it offers will be better than the way things are now.
In one of my jury duty experiences, I was part of a pool of about 250 potential jurors for a potential death penalty case: murder with special circumstances. In California, the first part of the case is to determine if the defendant is guilty. If found guilty, the same jury continues its service in the second phase where they hear the prosecution argues for the death penalty while the defense argues for life imprisonment. As in the guilty/not guilty phase, the jury decision must be unanimous.
After three days of jury selection, most of us (including me) were excused by either the judge, the prosecution or defense. The experience was informative. I read in the LA Times that jury selection went on for two more days. Ultimately, the jury found the defendant guilty of murder with special circumstances and in phase two returned a verdict for the death penalty.
My experience indicated to me that the death penalty is not given out thoughtlessly. Some argue that LA County's judicial system is more careful than other parts of California but the review and appeals process after conviction and sentencing probably catches any errors. However, after the review and appeals, the death penalty doesn't actually get carried out because there is no approved method of execution. Thus, California has the death penalty on the books and all the mechanisms in place (at great cost) but in practice there is no death penalty. Shall we make it official and vote in Prop 34? Or do we keep the death penalty on the books and work toward reorganizing the death penalty system?
Below is a video in support of the death penalty by Dennis Prager where he discusses common objections and points out the choice is between NO capital punishment for ANY murderer while those who support capital punishment call for it in SOME cases.
Vote YES on Prop 33.
At first hearing, it sounds good to allow portability of auto insurance discounts for people with continuous coverage. But why is the proposition being supported by only one auto insurance company? If this change in auto insurance regulation was supported by more auto insurance companies, I would be more confident in the measure. Although, I suppose if many insurance companies supported it, the NO on Prop 33 people would claim the insurance companies are teaming up trying to gouge the customers. So in a sense it is a no-win situation for the insurance companies. But the fact is that some of the ballot measures this year are sponsored by one/few individual(s) (Prop 33, Prop 35, Prop 39) or seems to offer benefits to only one particular group (see Prop 39) and that immediately raises a caution in my mind. But what about the merit of the idea? If someone you don't like offers a reasonable idea do you dismiss the idea because of the messenger? That, in the realm of logic, is known as the genetic fallacy.
Thus, the question is, on the merits, should continuity of insurance coverage be part of the rate calculation? There are currently three main factors in setting rates in California: driver's safety record, miles driven and years of experience driving. The other discounts they offer are probably relatively minor compared to those three main factors. Would adding continuity of insurance coverage be unreasonable? Could it be that some auto insurance companies actually like the current rules because they don't have to compete to retain customers and fight "churn" which often happens in the cell phone service business? This could account for why they have not joined for or against this measure; they like it the way it is.
UPDATE: I did a google search to see if this kind of discount exists in other states. I found this list of discounts from Nationwide in Maine. The discount amounted up to 5%. I checked a few other states to see if this kind of discounts is also available: Michigan (no), Oklahoma (no) and Georgia (yes, up to 10%). I don't plan to check all 50 states! But suffice to say, this type of discount exists in other states. Whether it is a many or a majority, I do not know.
DISCLAIMER: I am not a customer of Nationwide and have no financial interest in Nationwide. I simply happen to find their auto insurance discount information through a Google search.
Prop 32 - YES
The measure places some additional regulations on political contributions. In particular, it removes the ability to have funds deducted from paychecks for political purposes. As such, it is strongly opposed by unions which gets a lot of money by this method.
The public employee unions essentially control Sacramento. This Wall Street Journal opinion piece describes the degree of control in stark terms. Excerpt: The governor originally proposed raising the top rate to 12.3% from 10.3%. That wasn't good enough for the nurses and teachers unions, which pressed for a 13.3% "millionaire's tax." ..... Public unions then picked up about 75% of the tab for gathering signatures and paid workers twice the going rate ($3 per signature) to speed things along. .... And without so much as lifting a finger, the governor has raised $50 million for his ballot campaign—nearly four times as much as the opposition. Public unions have kicked in more than $30 million.
Prop 31 - Leaning to a NO vote.
The proposition institutes some new procedures to state budgeting. Everyone agrees that Sacramento is a mess. But will this measure make things better? Airtalk's October 2 program discussed Prop 31. After listening to the program and hearing Larry Mantle say after reading the proposition in preparation for the broadcast and still not feeling sure about understanding it I don't feel like a total idiot. And after listening to both sides give their case, I don't know who or what to believe.
My impressions is that maybe the people behind prop 31 decided to "shoot the moon" and loaded it up with a grab bag of reforms. Perhaps it would have been better if they just stuck to one or two key reforms that would be easily understood.
My adage on propositions is when in doubt: vote no.
Prop 30, 38 and 39 are tax increase propositions and I plan to vote NO on all three.
Prop 39 makes some changes to business taxes and allocates some of the revenue for clean energy jobs. The first problem is that California is rated (according to Taxfoundation.org) as one of the worst in regards to business taxes compared to other states and so this is not going to repair the reputation of California as not business friendly. Secondly, even if the changes to the business taxes in Prop 39 were a good idea which this might actually be, why commit 1/2 of the revenue to clean energy jobs? California's budget is so out of balance, why carve out money for ONE specific sector of the economy? Sounds fishy to me that the supporters wrote a set-aside like this into the proposition.
Prop 30 and 38 raise taxes for education funding. The way they do so is different with Prop 30 being advocated by Gov. Brown and calls for a mix of increased income taxes and sales taxes. Prop 38 is backed by political activist Molly Munger and raises income taxes.
Education, of course, is a good cause. However, I am very concerned that the public school system needs to be reformed before more money is spent on it. I don't want to as the idiom goes "throw good money after bad." Also, I simply don't trust Sacramento to actually get the money to the right place.
Be sure to check out Reason Foundation where their concerns about Prop 38 was expressed this way:
... for 10 years the state has "deferred" nearly $10 billion of state revenue that is supposed to go to schools under Prop. 98. So even when we think we are voting to tie the government’s hands on how they spend our tax money, they seem to find ways around it. The problem is that Sacramento is not making education a budget priority.
In Reason's Prop 30 comments they offer this: Finally, since education spending has become the rhetorical lynchpin of Prop. 30, voters need to consider if they want more of their money to go into a system that refuses to reform, and where increases in spending are overwhelmingly being consumed by administration, not going to teachers and classrooms and instruction.
As of October 30 ...
Let's take the easy one first ...
Prop 40 is the easiest with a YES vote.
Prop 40 is a yes/no vote on the new state senate district lines drawn up as a result of the 2010 census. There is no opposition to Prop 40 in any newspaper editorial board or major political party.
The rest are a bit more complicated and as I read through them and form a view, I'll post them below.
Vote NO on Prop 37.
This ballot calls for labeling of some food items to let the consumer know it contains genetically modified ingredients. This Freakonomics.com item highlights some of the problems with the labeling plan. Problem number one is that numerous scientific organizations have gone on record as saying that genetically modified food items are safe. Problem number two is that enforcing this kind of law can be complicated - which items should and should not have the labels - will likely result in lawsuits and could result in costly changes up and down the food production chain to comply with it. Because of all these headaches for no safety benefit, the six newspaper editorial boards I checked all came out against it.
The three-strikes law has broad support and this proposition modifies it in ways that make sense: if the third-strike conviction is not in the category of a serious or violent crime then the heavy punishment required in the current law doesn't apply. This revision to the three-strikes law is supported by all six newspaper editorial boards I checked.
Vote ??? on Prop 35 - leaning toward a NO.
Human trafficking is a terrible crime. Law enforcement should do all it can to stop it. Since Prop 35 claims to fight human trafficking it is likely to gain a lot of support. But is the ballot measure well thought out?
Its a good cause but there is some doubt the measure will actually address the problem. The LA Times and Sacramento Bee came out against Prop 35. The Bee gave its reasons: It's difficult to oppose Proposition 35, a measure that purports to stop a crime as despicable as human trafficking. But the proposition is overbroad and misdirected. The LA Times gave similar reasons: Sex trafficking of minors is a real problem. There is evidence that in Southern California, gangs that once sold drugs are turning now to forced prostitution, especially of vulnerable girls (and sometimes boys) in foster care. Effectively targeting the problem requires carefully crafted and thoughtful laws that keep pace with the constantly changing practices in the shadowy world of human exploitation. Proposition 35 is not equal to the task. However, four other newspaper editorial boards came out in favor as did BOTH the Democrat and Republican parties. The OC Register's endorsement also noted some of the problems with the ballot measure but gave its endorsement despite those reservations. KPCC Airtalk had the two sides on their October 16 show. The supporter of Prop 35 was a prosecutor and the opponent was a sponsor of the current human trafficking laws that are on the books already in California.
How would you vote on such an item?
Have to say, when I am in doubt, I tend to vote no.
NO on Prop 34.
This proposition ends the death penalty in California. If you oppose the death penalty for whatever reasons, the choice is rather obvious. But those who support the death penalty but find the current system unworkable may be tempted to support this proposition figuring what it offers will be better than the way things are now.
In one of my jury duty experiences, I was part of a pool of about 250 potential jurors for a potential death penalty case: murder with special circumstances. In California, the first part of the case is to determine if the defendant is guilty. If found guilty, the same jury continues its service in the second phase where they hear the prosecution argues for the death penalty while the defense argues for life imprisonment. As in the guilty/not guilty phase, the jury decision must be unanimous.
After three days of jury selection, most of us (including me) were excused by either the judge, the prosecution or defense. The experience was informative. I read in the LA Times that jury selection went on for two more days. Ultimately, the jury found the defendant guilty of murder with special circumstances and in phase two returned a verdict for the death penalty.
My experience indicated to me that the death penalty is not given out thoughtlessly. Some argue that LA County's judicial system is more careful than other parts of California but the review and appeals process after conviction and sentencing probably catches any errors. However, after the review and appeals, the death penalty doesn't actually get carried out because there is no approved method of execution. Thus, California has the death penalty on the books and all the mechanisms in place (at great cost) but in practice there is no death penalty. Shall we make it official and vote in Prop 34? Or do we keep the death penalty on the books and work toward reorganizing the death penalty system?
Below is a video in support of the death penalty by Dennis Prager where he discusses common objections and points out the choice is between NO capital punishment for ANY murderer while those who support capital punishment call for it in SOME cases.
Vote YES on Prop 33.
At first hearing, it sounds good to allow portability of auto insurance discounts for people with continuous coverage. But why is the proposition being supported by only one auto insurance company? If this change in auto insurance regulation was supported by more auto insurance companies, I would be more confident in the measure. Although, I suppose if many insurance companies supported it, the NO on Prop 33 people would claim the insurance companies are teaming up trying to gouge the customers. So in a sense it is a no-win situation for the insurance companies. But the fact is that some of the ballot measures this year are sponsored by one/few individual(s) (Prop 33, Prop 35, Prop 39) or seems to offer benefits to only one particular group (see Prop 39) and that immediately raises a caution in my mind. But what about the merit of the idea? If someone you don't like offers a reasonable idea do you dismiss the idea because of the messenger? That, in the realm of logic, is known as the genetic fallacy.
Thus, the question is, on the merits, should continuity of insurance coverage be part of the rate calculation? There are currently three main factors in setting rates in California: driver's safety record, miles driven and years of experience driving. The other discounts they offer are probably relatively minor compared to those three main factors. Would adding continuity of insurance coverage be unreasonable? Could it be that some auto insurance companies actually like the current rules because they don't have to compete to retain customers and fight "churn" which often happens in the cell phone service business? This could account for why they have not joined for or against this measure; they like it the way it is.
UPDATE: I did a google search to see if this kind of discount exists in other states. I found this list of discounts from Nationwide in Maine. The discount amounted up to 5%. I checked a few other states to see if this kind of discounts is also available: Michigan (no), Oklahoma (no) and Georgia (yes, up to 10%). I don't plan to check all 50 states! But suffice to say, this type of discount exists in other states. Whether it is a many or a majority, I do not know.
DISCLAIMER: I am not a customer of Nationwide and have no financial interest in Nationwide. I simply happen to find their auto insurance discount information through a Google search.
Prop 32 - YES
The measure places some additional regulations on political contributions. In particular, it removes the ability to have funds deducted from paychecks for political purposes. As such, it is strongly opposed by unions which gets a lot of money by this method.
The public employee unions essentially control Sacramento. This Wall Street Journal opinion piece describes the degree of control in stark terms. Excerpt: The governor originally proposed raising the top rate to 12.3% from 10.3%. That wasn't good enough for the nurses and teachers unions, which pressed for a 13.3% "millionaire's tax." ..... Public unions then picked up about 75% of the tab for gathering signatures and paid workers twice the going rate ($3 per signature) to speed things along. .... And without so much as lifting a finger, the governor has raised $50 million for his ballot campaign—nearly four times as much as the opposition. Public unions have kicked in more than $30 million.
Prop 31 - Leaning to a NO vote.
The proposition institutes some new procedures to state budgeting. Everyone agrees that Sacramento is a mess. But will this measure make things better? Airtalk's October 2 program discussed Prop 31. After listening to the program and hearing Larry Mantle say after reading the proposition in preparation for the broadcast and still not feeling sure about understanding it I don't feel like a total idiot. And after listening to both sides give their case, I don't know who or what to believe.
My impressions is that maybe the people behind prop 31 decided to "shoot the moon" and loaded it up with a grab bag of reforms. Perhaps it would have been better if they just stuck to one or two key reforms that would be easily understood.
My adage on propositions is when in doubt: vote no.
Prop 30, 38 and 39 are tax increase propositions and I plan to vote NO on all three.
Prop 39 makes some changes to business taxes and allocates some of the revenue for clean energy jobs. The first problem is that California is rated (according to Taxfoundation.org) as one of the worst in regards to business taxes compared to other states and so this is not going to repair the reputation of California as not business friendly. Secondly, even if the changes to the business taxes in Prop 39 were a good idea which this might actually be, why commit 1/2 of the revenue to clean energy jobs? California's budget is so out of balance, why carve out money for ONE specific sector of the economy? Sounds fishy to me that the supporters wrote a set-aside like this into the proposition.
Prop 30 and 38 raise taxes for education funding. The way they do so is different with Prop 30 being advocated by Gov. Brown and calls for a mix of increased income taxes and sales taxes. Prop 38 is backed by political activist Molly Munger and raises income taxes.
Education, of course, is a good cause. However, I am very concerned that the public school system needs to be reformed before more money is spent on it. I don't want to as the idiom goes "throw good money after bad." Also, I simply don't trust Sacramento to actually get the money to the right place.
Be sure to check out Reason Foundation where their concerns about Prop 38 was expressed this way:
... for 10 years the state has "deferred" nearly $10 billion of state revenue that is supposed to go to schools under Prop. 98. So even when we think we are voting to tie the government’s hands on how they spend our tax money, they seem to find ways around it. The problem is that Sacramento is not making education a budget priority.
In Reason's Prop 30 comments they offer this: Finally, since education spending has become the rhetorical lynchpin of Prop. 30, voters need to consider if they want more of their money to go into a system that refuses to reform, and where increases in spending are overwhelmingly being consumed by administration, not going to teachers and classrooms and instruction.
As of October 30 ...
30 - NO
31 - NO?
32 - YES
33 - YES
34 - NO
35 - NO??
36 - YES
37 - NO
38 - NO
39 - NO
40 - YES
Politics: The Sequestor
 Image source: http://upload.wikimedia.org/wikipedia/en/2/2b/U.S._Federal_Spending_-_FY_2011.png
The sequestor says that over ten-years, $600 billion needs to be cut in discretionary spending and $600 billion needs to be cut in defense spending. Thus, the target would be $60 billion in each of the two items per year.
Of course, looking at the chart, that leaves 63% of the budget untouched. The 6% that is interest payments is untouchable in the sense not paying it would be defaulting. As a political matter (and perhaps as a legal one as well), the other mandatory, Social Security and Medicare & Medicaid is virtually untouchable.
And that is really the problem: it is hard to balance a budget when 57% of the budget essentially isn't on the table for cuts.
Imagine if we could get at all segments of the pie except interest payments?
How about cutting $24 billion from each of the five pie segments?
Or how about slicing $20 billion from each of the five portions and close loopholes to raise $20 billion in new taxes?
Or how about $16 billion from the five broad categories of spending and raise taxes by $40 billion?
Under the 16/40 scenario, if indeed, about 53% of the people pay Federal Income taxes (159 million of 300 million people) then that is about $252 more per tax-payer.
As you can see, opening all parts of the pie makes things more manageable.
Politics: Rasmussen and Gallup Diverge On 2012
Rasmussen and Gallup Diverge On 2012 ... at the moment, as of this Friday morning, as I look at the RCP numbers. Gallup is saying Romney by 7% and Rasmussen has it tied. Rasmussen claims an MoE of 3%, so the tie could really be a 6 point lead for either side. Gallup cites an MoE of 2%, so Romney's lead could be as big as 11 and as small as 3.
Why are the two polls so divergent?
The likely voter screens they apply are different. But I wonder what aspect of their screens is leading to such different results? Any polling experts out there who can offer a hypothesis as to why the 2 big name polls are so different at this moment?
We shall see if the divergence continues.
At the moment, on RCP, Gallup is the "outlier" data point with the race being much closer if one aggregates the polls.
UPDATE: Jay Cost of the Weekly Standard was on the Hugh Hewitt radio show and suggested that Gallup's use of a tight likely voter screen ironically makes it more volatile to momentum shifts. Thus, the direction of many polls in favor of Romney results in Gallup perhaps overstating the movement. Anyway, that was the impression I got from what he was saying in the interview.
Politics: Nov 2012 California Ballot Measures as Viewed by Newspapers
Proposition
|
||||||
30
|
Endorse
|
Endorse
|
Endorse
|
Endorse
|
Oppose
|
Oppose
|
31
|
Endorse
|
Oppose
|
Endorse
|
Oppose
|
Oppose
|
Endorse
|
32
|
Oppose
|
Oppose
|
Oppose
|
Oppose
|
Endorse
|
Endorse
|
33
|
Oppose
|
Oppose
|
Oppose
|
Oppose
|
Endorse
|
Oppose
|
34
|
Endorse
|
Endorse
|
Endorse
|
Endorse
|
Oppose
|
???
|
35
|
Endorse
|
Oppose
|
Endorse
|
Oppose
|
Endorse
|
Endorse
|
36
|
Endorse
|
Endorse
|
Endorse
|
Endorse
|
Endorse
|
Endorse
|
37
|
Oppose
|
Oppose
|
Oppose
|
Oppose
|
Oppose
|
Oppose
|
38
|
Oppose
|
Oppose
|
Oppose
|
Oppose
|
Oppose
|
Oppose
|
39
|
Oppose
|
Endorse
|
Endorse
|
Endorse
|
Oppose
|
Oppose
|
40
|
Endorse
|
Endorse
|
Endorse
|
Endorse
|
Endorse
|
???
|
Subscribe to:
Posts (Atom)