The web site that archives the readings is located at the University of Alabama in Huntsville Earth System Science Center.
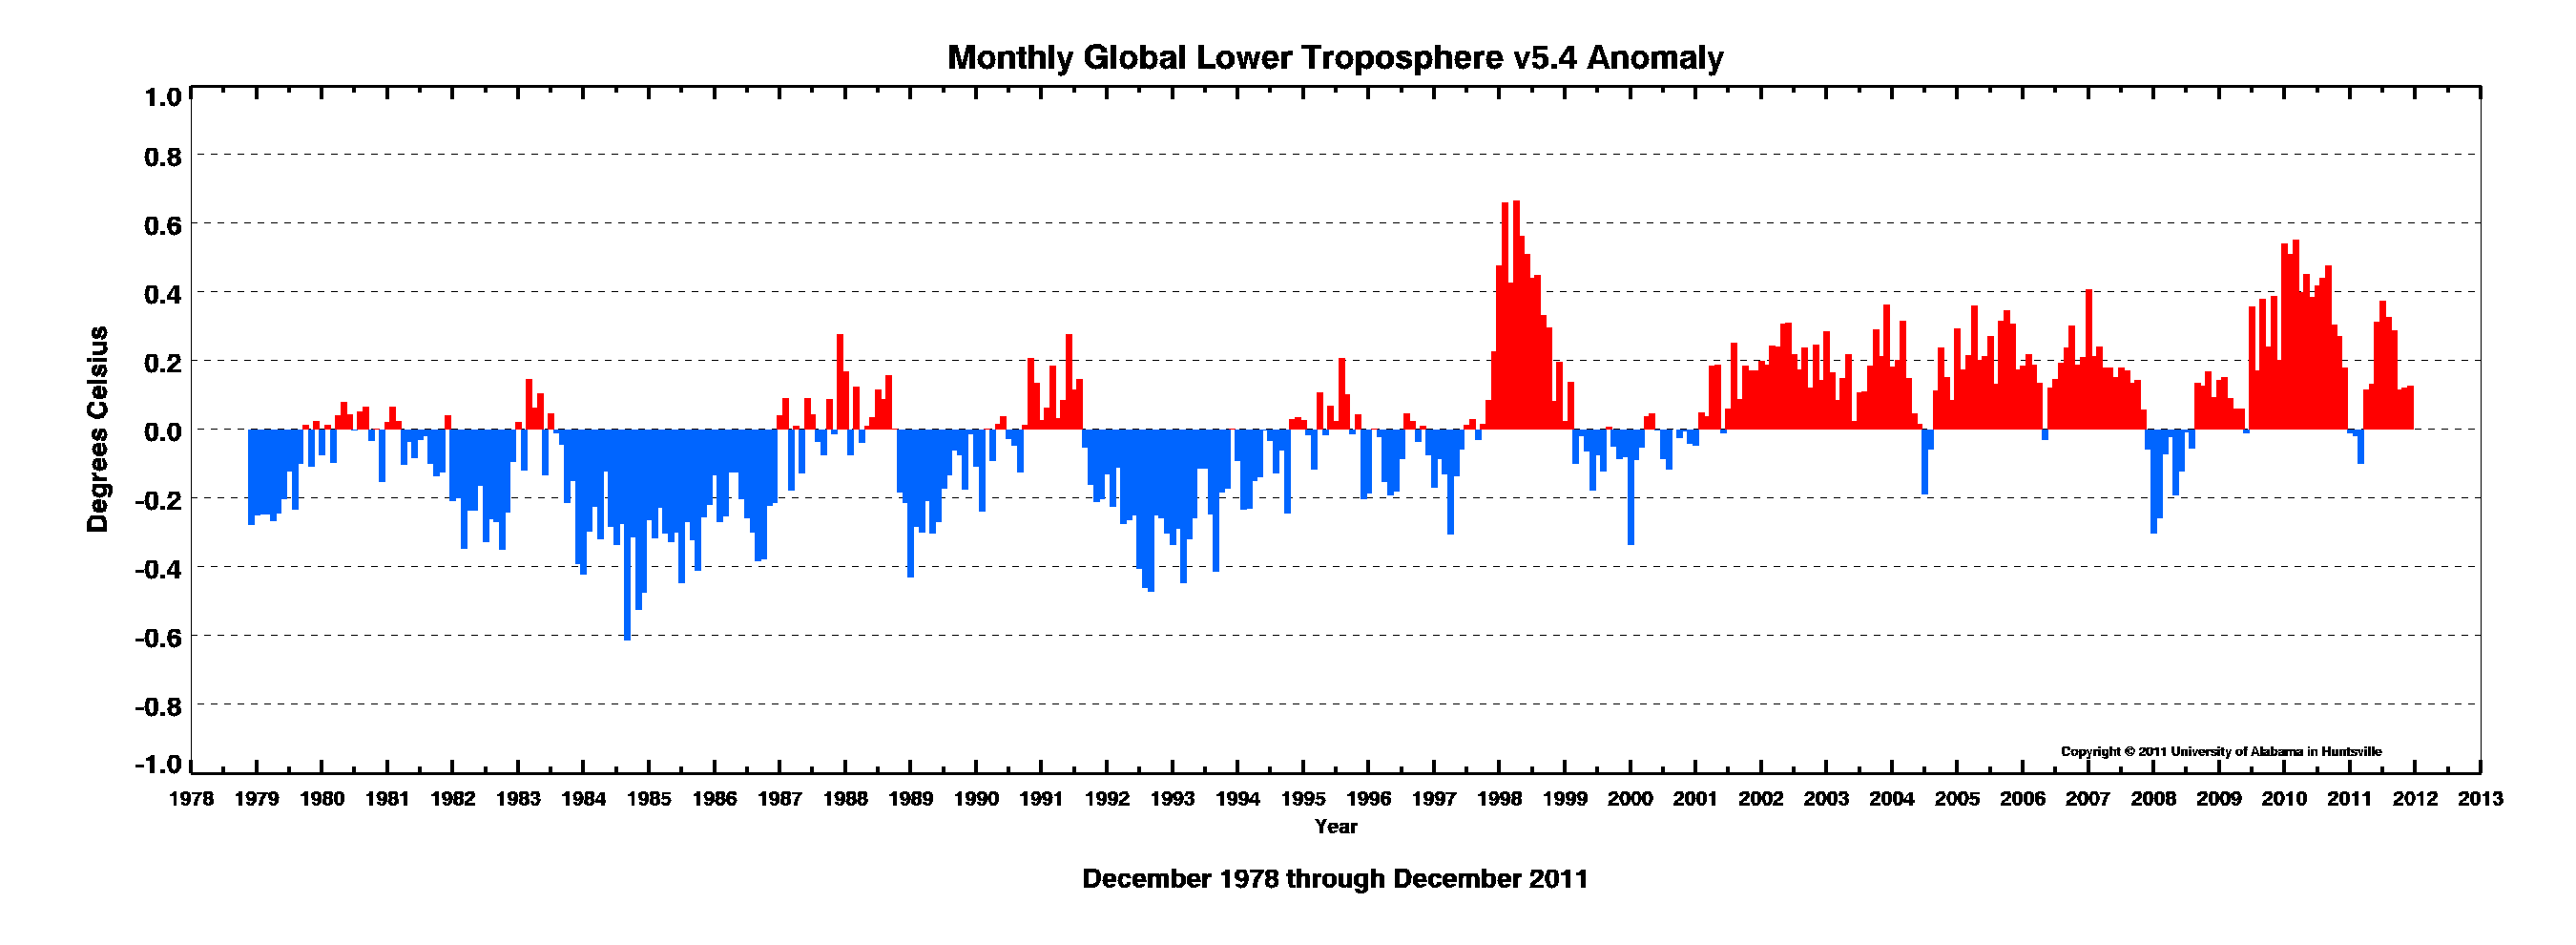
To see a graph of the data they have been collecting. Or click on the image below.

The data has only been collected since 1978. In the grand scheme of the age of the earth, this is almost nothing. Since industrialization (around 1800), this represents about 16%
There other data regarding the question of global warming is greenhouse gases of which CO2 gets the most attention.
There are the measurements of greenhouse gases at various sites compiled at Cape Grim in Australia since 1976.

Obviously, these two bits of data aren't the only things to consider in the question of global warming.
One can say that CO2 levels are rising.
One can say the last decade has seen above average temperatures as measured by O2 vibrations though the actual rise is somewhat modest.
Looking at the basis of the temperature graph more carefully, the y-axis is based on the differential relative to the average temperatures from 1979-2011 so what is informative is the slope of the line since the beginning of the data collection (see the Dec2011GTR pdf file at UAH archive). If I'm using my Excel program correctly (forecast function) on the annual numbers from the Dec2011GTR.pdf file), one can obtain a line through the dots with a slope of 0.014C/year. Thus, if the rate of change remains constant, 100 years from now, there should be a 1.4C rise in average surface temperatures relative to the average over 1979-2011.
I suspect the one key to understanding the issue is to understand the field of paleoclimatology - studying what temperatures were like on earth in historic time scales - and thus relying on temperture and CO2 readings established by other methods than what we have seen in the graphs above. And the other key is the modeling to project into the future what the temperatures might be.
No comments:
Post a Comment